


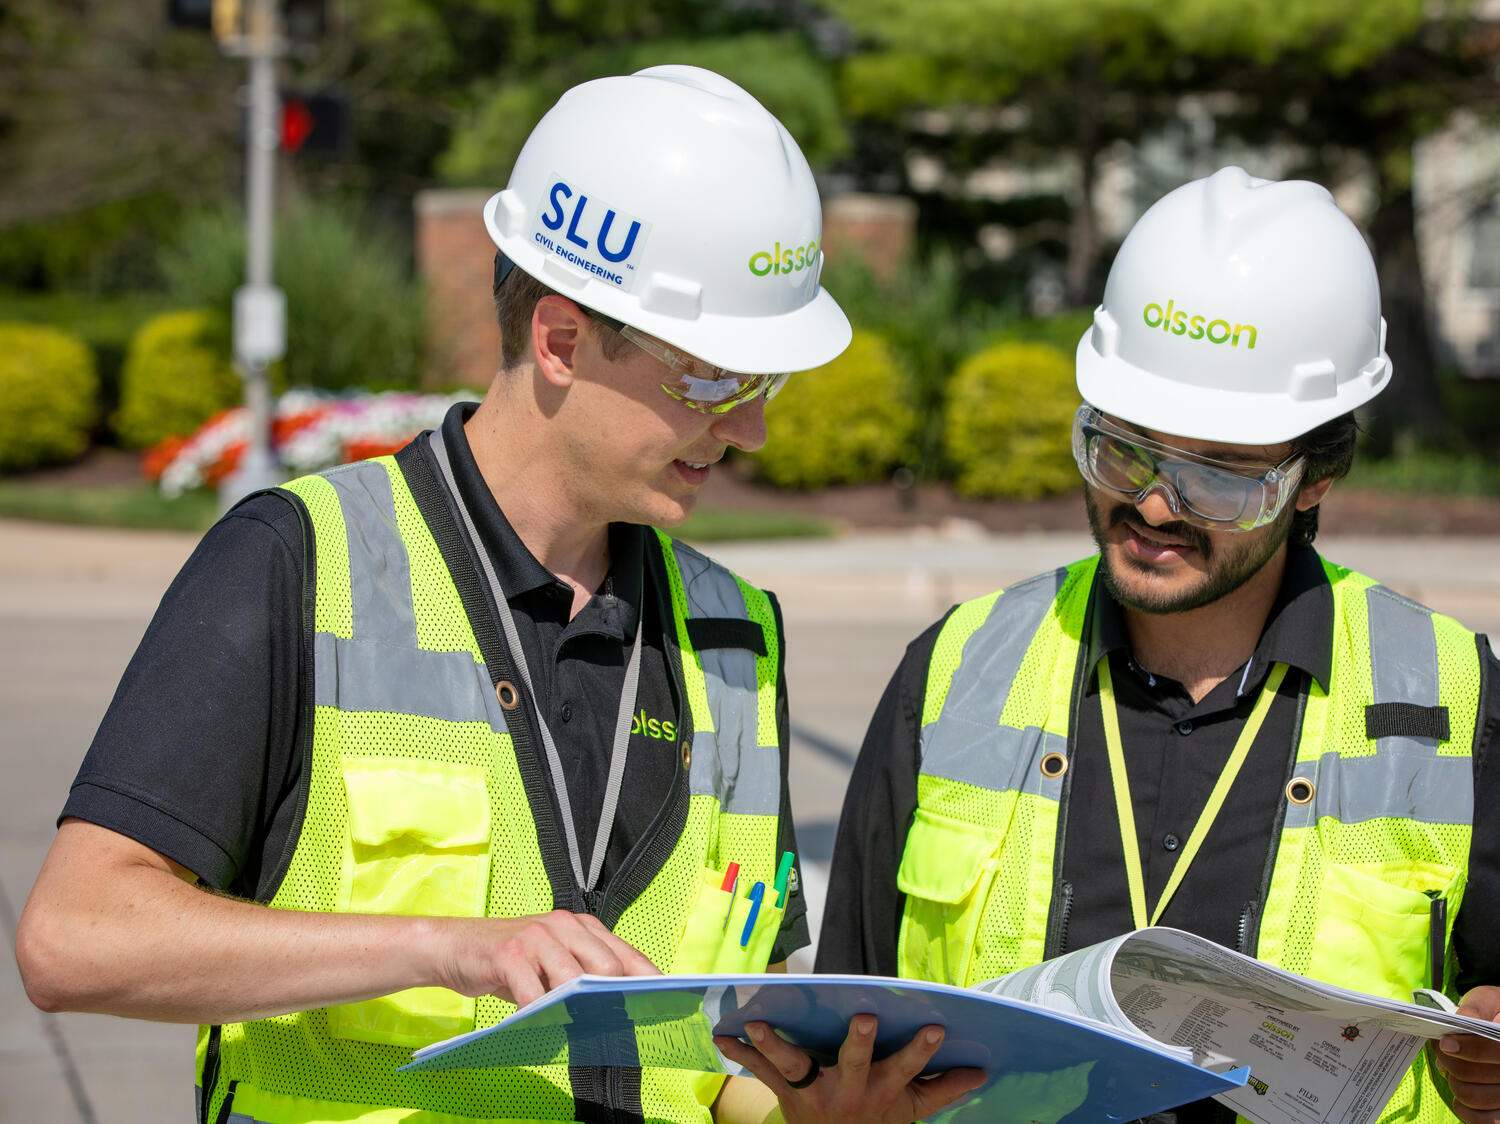


.avif)


Using remote sensors to mine data is more complex than it appears. To put it succinctly, there’s a lot more to it than attaching sensors to the bottom of a drone and taking photos.
Just ask Gunnar Malek-Madani – he’s an expert on using remote sensing to discover hard-to-find, objective information.
Gunnar, an associate scientist on Olsson’s Nebraska Environmental team, recently published his findings about using remote sensing techniques to estimate gross primary production (GPP) in corn and soybeans. He collaborated with a former student, Anthony Nguy-Robertson, and three professors, Elizabeth Walter-Shea, Andrew Suyker, and Timothy Arkebauer, on his research, which he completed for his master’s degree in geography from the University of Nebraska-Lincoln.
Thanks to Gunnar’s work, researchers in Nebraska and neighboring states will be able to determine crop productivity at a regional scale simply by using technology and data analytics extracted using remote sensing methods.
The article, titled Modeling Gross Primary Productivity for Midwestern U.S. Maize and Soybean Croplands with Satellite and Gridded Weather Data, was published in Remote Sensing, a journal from MDPI that is a forum for scientific exchange in all forms across all disciplines.
Discovering GPP using remote sensing techniques involved more than a drone and a camera.
“When most people hear remote sensing, they think it’s only about taking pictures, looking at them, and manually drawing boundaries,” Gunnar said. “They think it’s only about air photo interpretation. But remote sensing actually uses scientific methods to look at images that are from different parts of the electromagnetic spectrum and that are not visible to the human eye. We’re using a lot of near-infrared and infrared imagery to determine aspects of a landscape that absorb and reflect solar radiation at different rates.”
Remote sensing derives information about the earth’s land and water surfaces from images taken from an overhead perspective using electromagnetic radiation in one or more regions of the electromagnetic spectrum. Using remote sensors allows scientists to see patterns and relationships instead of isolated images and data.
Remote sensors detect the color of light plants absorb and reflect. Healthy vegetation absorbs a large amount of red and blue light and then reflect near-infrared light not visible to the naked eye. Scientists can ratio those bands together to determine the amount of reflectance from the different parts of the spectrum, and that reveals the value of how healthy and how productive the vegetation is. Scientists can then easily apply statistical methods to remote sensing data to convert the data into actionable information.
Using remote sensing allows scientists to determine plant health over time, even before the plant shows signs of stress. As plants begin to experience water stress, their spectral properties begin to change, and they start to reflect more visible light and absorb more near-infrared light. To the naked eye, the plant may look green as its stress levels change, but by ratioing the observations from different parts of the spectrum, scientists can detect stress that is occurring before it is visible.
Gunnar’s research used satellite imagery to determine the leaf area of large fields that would take biologists days to walk and track information. He then combined this index with freshly available geographic information system (GIS) weather data sets to calculate how productive the fields were. Instead of producing a photo of an image, remote sensors generate a matrix of numbers of pixel values. Scientists then ratio various data sets together to determine the index values of vegetation.
“This is an objective science that is quantifiable, testable, and easily used with statistics,” Gunnar said.
An added benefit is that researchers can use these techniques to go back in time. The imagery and GIS data go back more than 10 years, so researchers are able to determine how productive fields have been over time and compare this baseline with current results.
Much of what Gunnar can do with GIS mapping remote sensing skills is applicable to Olsson’s work, especially in wetland identification and vegetation management, said Chris Jorgensen, a project scientist on the Nebraska Environmental team.
Large land development, solar projects that covers a wide area of land, power transmission or pipelines, and major road projects could all benefit from using remote sensing to manage vegetation in a large-scale project.
“Using remote sensing is less subjective,” Chris said. “If you send three biologists out to determine a wetland boundary, they might come back with three different recommendations. When you use imagery and some sort of classification algorithm to determine the size of wetlands, you get a more precise reading and it’s repeatable over a long period of time.”
According to Gunnar, remote sensing methods used in his research are more objective than current methods used in the field. These methods remove human biases and can quantify traits of a landscape. Scientists can also more accurately quantify changes on a landscape over a long period of time.
“Let’s say you’re interested in tracking changes to a section of the Platte River, to see how much it meanders every year,” Gunnar said. “You could fly – either in a drone or airplane – a certain area, quantify the amount of water and the area of the channels, and map the sandbars to determine how much the river has changed.”
The Nebraska Environmental team has already benefited from using remote sensing practices and publicly available multispectral aerial imagery. The team used it to classify a landcover for permitting purposes to determine the acres of forested, agricultural, grasslands, and water on a 100,000-acre wind farm. Our team was able to do this early in the process, even before all the leases were signed with landowners and before they had on-the-ground access to private property.
Team members also used remote sensing techniques to determine the habitat of the northern long-eared bat, a federally threatened species. They were able to quantify the bat’s habitat using up-to-date satellite imagery rather than the latest landcover data set, which is typically at least five years old.
“We were able to use our own data set of these potential habitat locations and, by combining that data with spatial GIS data, we were able to determine the bat’s habitat in a way that’s more precise and accurate than just using the data that’s available online,” Gunnar said. “We were able to get sign-off on our findings and we didn’t have to send anybody into the field for that.”
“As of right now, remote sensing use in engineering isn’t the norm, but we think the acceptance of these methods will become more widespread over time.”
